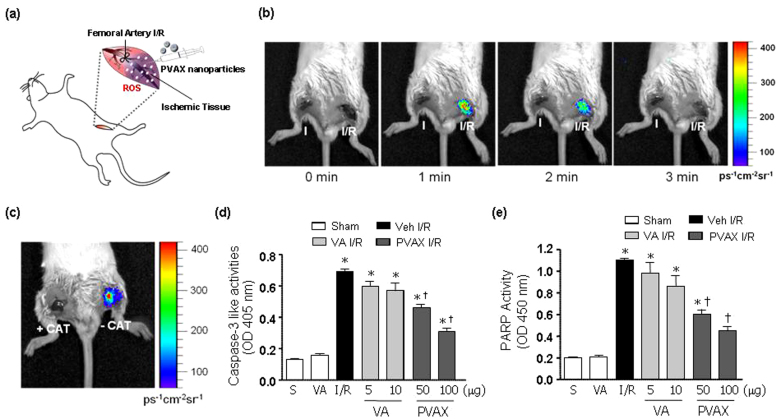
Figure 3. Bioimaging and apoptosis in hind-limb I/R model after PVAX in vivo.
(a) A schematic diagram of hind-limb ischemia/reperfusion protocol. (b) In vivo imaging of PVAX/Rb after I/R in mouse hind-limbs. Reperfusion at different time points as indicated. Acquisition time = 30 sec/image. (c) In vivo imaging of PVAX/Rb with and without catalase. (d - e) Quantification of caspase-3 activities (d) and PARP-1 activity (e) after I/R with different concentrations of PVAX in gastrocnemius muscles. *, P < 0.05 vs Sham; †, P < 0.05 vs Veh + IR. N = 4–6/group.

