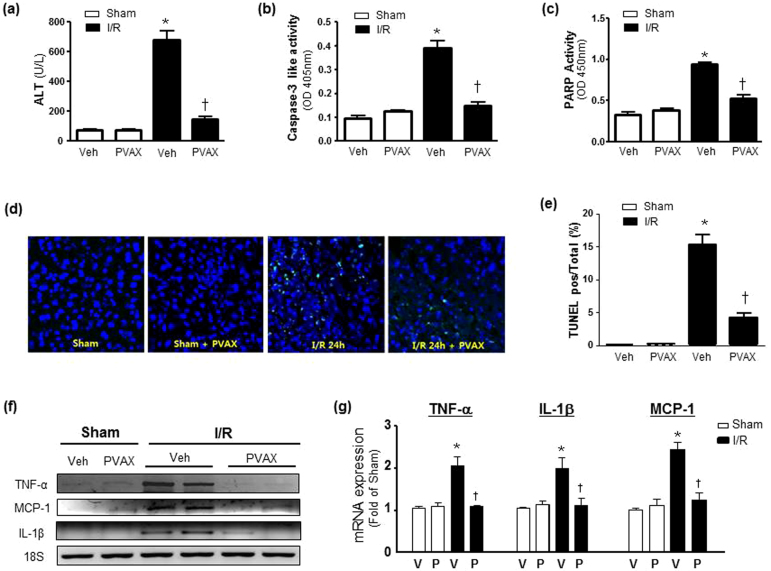
Figure 5. I/R-specific therapy using PVAX in hepatic I/R model in vivo.
(a) Serum ALT level after 60 min ischemia and 6 h reperfusion with or without i.p. administration of PVAX. *, P < 0.05 versus Sham; †, P < 0.05 versus Veh + I/R. N = 4–6/group. (b–c) Quantification of caspase-3 activities (b) and PARP-1 activity (c) of the liver after I/R with and without PVAX. *, P < 0.05 versus Sham; †, P < 0.05 versus Veh + I/R. N = 4–6/group. (d) Representative TUNEL staining of liver after I/R with and without PVAX. (e) Quantification of apoptosis rate in liver after I/R with and without PVAX. *, P < 0.05 versus Sham; †, P < 0.05 versus Veh + I/R. N = 4–6/group. (f) Semi-quantitative PCR of mRNA levels of factors associated with inflammation after i.p. administration of PVAX after hepatic I/R. (g) Quantification of TNF-α, MCP-1 and IL-1β mRNA levels after I/R with or without PVAX in hepatic I/R model. *, P < 0.05 versus Sham; †, P < 0.05 versus Veh + I/R. N = 4–6/group.

