
Figure 7.
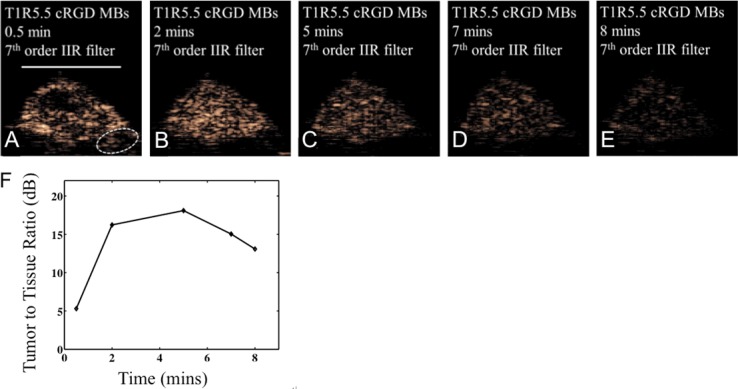
IIR filtered broadband (T1R5.5) images acquired at 0.5, 2, 5, 7, and 8 minutes after the injection of RGD-targeted microbubbles. A, B: Echoes from the surrounding vasculature are relatively low at the 2 minute time point. C-E: The intensity of bound microbubbles in the tumor region decreases with time. The scale bar represents 5 mm. F: The tumor-to-tissue ratio increases to 16.2 dB at 2 minutes, reaching a maximum at approximately 5 minutes before decreasing.