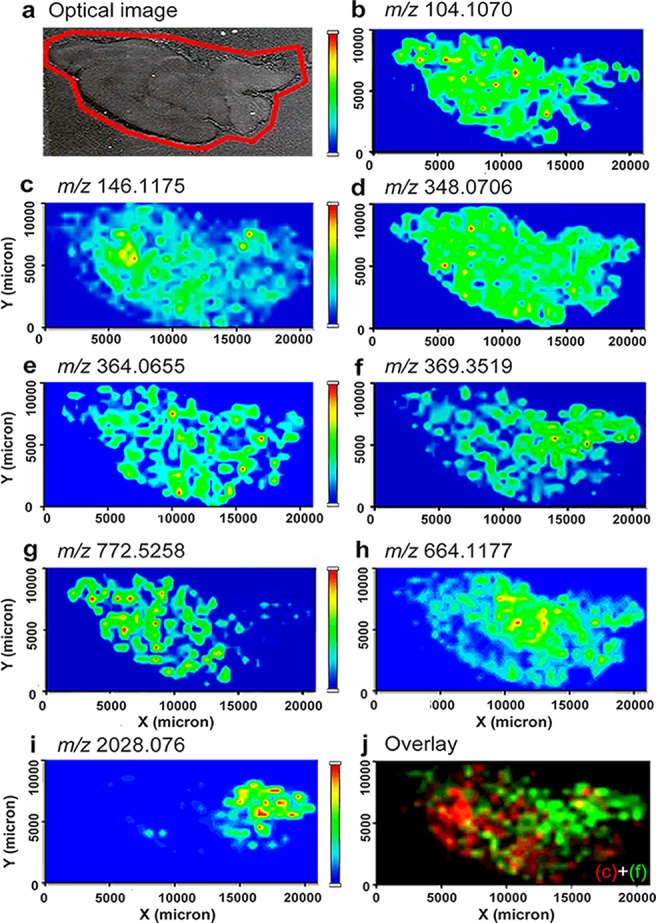
Figure 2.

MS images of metabolites and NTs identified from rat CNS. (a) Optical image of a rat brain section subjected to MSI sample preparation. (b–g) MS image of metabolites and NTs, including (b) choline at m/z 104.1070, (c) ACh at m/z 146.1175, (d) AMP at m/z 348.0706, (e) GMP at m/z 364.0655, (f) cholesterol with neutral loss at m/z 369.3519, (g) potassiated PC(32:0) at m/z 772.5258, and (h) nicotinamide adenine dinucleotide at m/z 664.1177. Other than low MW molecules, (i) MS image of the acetylated peptide ASQKRPSQRHGSKYLATA at m/z 2028.076 was also shown. (j) Overlaid image of a NT, ACh, as in (c) and cholesterol-derived ion as in (f).
