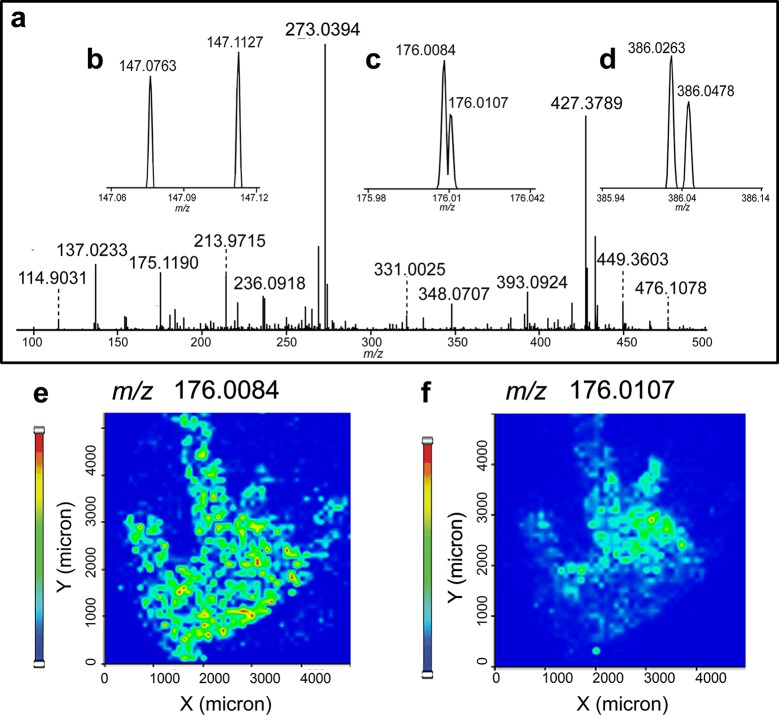
Figure 3.
HRMSI spectra averaged from a blue crab brain section acquired on a MALDI LTQ Orbitrap XL. (a) Averaged HRMS spectra displaying the m/z range of 90–500. (b–d) Zoomed-in spectra shown in (a) over the range of (b) m/z 147.06–147.12, (c) m/z 175.98–176.04, and (d) m/z 385.94–386.14. Panels (e) and (f) display different distributions of two ions present in (c) from blue crab brain.

