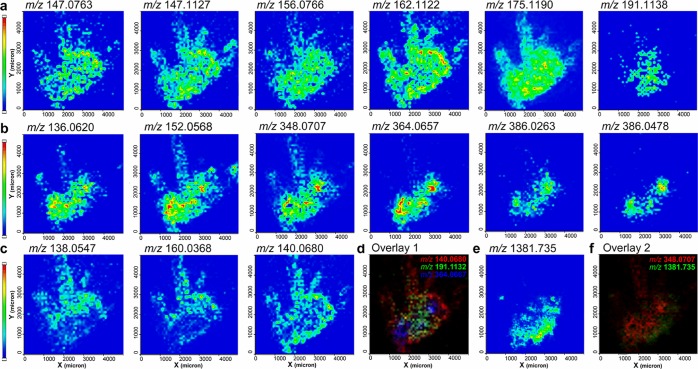
Figure 4.
MS images of metabolites identified from crustacean CNS. (a) MS images of amino acids, including (from left to right) glutamine, lysine, histidine, carnitine, arginine, and hydroxyarginine. (b) MS images of nucleobase-derived metabolites, including (from left to right) adenine, guanine, AMP, GMP, potassiated AMP, and sodiated GMP. (c) MS images of organic acids, including the protonated and sodiated aminobenzoic acid and the sodiated aminopentanoic acid. (d) Overlaid image of the sodiated aminopentoic acid in red, the hydroxyarginine in green, and GMP in blue. Other than small molecules, (e) MS image of the neuropeptide GYRKPPFNGSIFa displayed a distinct distribution from all the metabolites shown above. (f) Overlaid image of AMP coded in red and the neuropeptide SIFamide shown in green.

