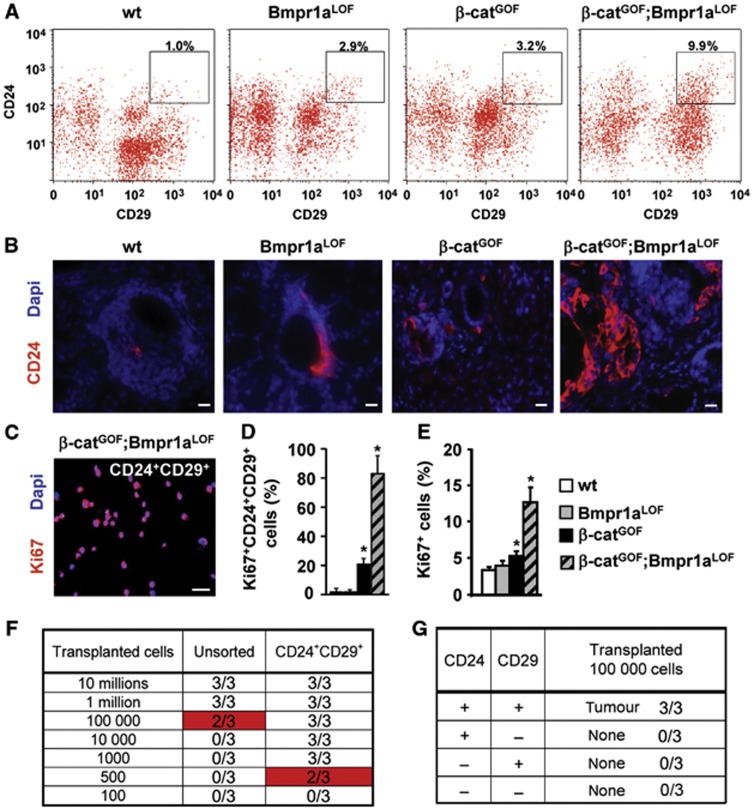
Figure 2.
Wnt/β-catenin and Bmp signalling control tumour propagating cells in salivary glands of mice. (A) FACS analysis of control (wt) and mutant salivary gland cells. High CD24+CD29+ expressing cells are marked by squares (insets), and quantification is shown above the squares (details on isotype control staining are shown in Supplementary Figure 3). (B) Sections of control and mutant salivary glands stained by immunofluorescence for CD24 (in red, DAPI in blue). (C, D) Identification of proliferating cells within the CD24+CD29+ salivary gland cell populations of all genotypes by immunofluorescence of cytospins for Ki67 (in red, DAPI in blue). Staining of double-mutant cells is shown in (C), quantification for all genotypes is shown in (D) (n=3). The bars give means and standard deviations (*P<0.05, Student’s t-test). P-values are as compared with wild-type cells. Bar, 25 μm. (E) Quantification of proliferation in salivary gland cells of control and mutant mice, as determined by immunofluorescence for Ki67 (n=3). The bars give means and standard deviations (*P<0.05, Student’s t-test). P-values are as compared with wild-type cells. (F) Tumour outgrowths produced from subcutaneous injections of different cell numbers of unsorted or sorted CD24+CD29+ cells from β-catGOF;Bmpr1aLOF double-mutant glands into the back skin of NOD/SCID mice (each group n=3, details on serial transplantations are provided in Supplementary Figure 4F and G). (G) Tumour formation capacity of other sorted subpopulations of cells of β-catGOF;Bmpr1aLOF double-mutant glands (each group n=3). Single CD24+ or CD29+ or CD24−/CD29− cells from double-mutants did not produce tumours.

