
Figure 2.
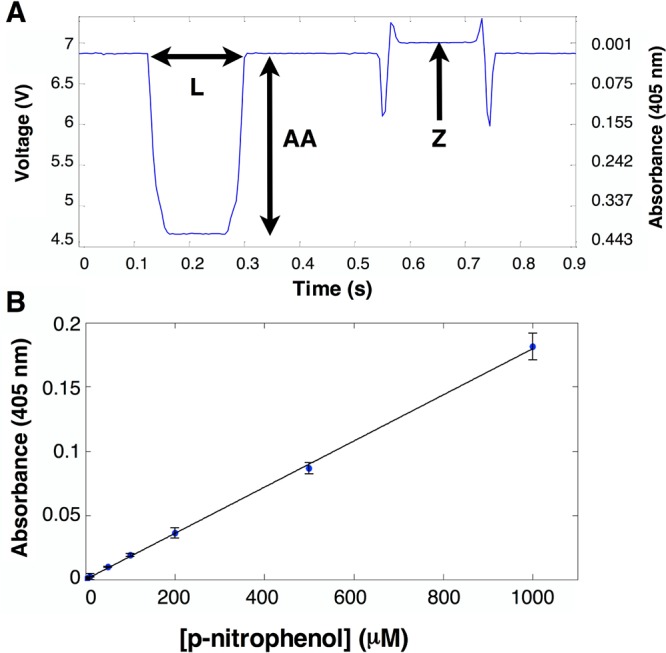
(A) Quantifying absorbance in droplets. A typical trace of an absorbance read-out (A405 nm) for two droplets (representing sample-loaded and empty compartments) flowing through a PTFE tubing (200 μm diameter). The first signal refers to a droplet containing 4-nitrophenol (2 mM) in PBS buffer, and the second containing buffer only. Each droplet was interrogated with an LED source with a peak emission at 405 nm. L defines the residence time of the droplet in the detection zone and corresponds to the length of the droplet. AA is the average absorbance of the droplet contents. The recovered signal for buffer droplets corresponded to the highest voltage and was defined as zero absorbance (Z). In this example, the continuous oil phase had an absorbance A405 nm of approximately 0.02. The signal spikes (at the droplet extremities) are a result of edge effects that are brought about by refractive index changes between the aqueous and oil phases. (B) Calibration of the absorbance detection with 4-nitrophenol. Premade dilutions were introduced into the loading tubes of the carousel, and the droplet absorbance was read for each condition (n = 5). The data correlate linearly (R2 of 0.99), and the detection limit (three standard deviations above the background noise) suggests that measurements down to 3 μM 4-nitrophenol are possible.