
Figure 3.
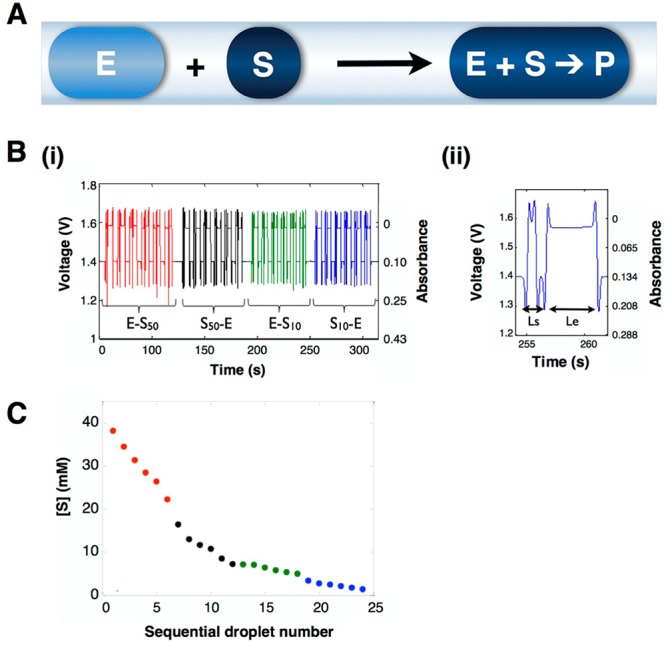
(A) Merging scheme for a pair of microdroplets inside tubing. A large compartment loaded with enzyme (E) will catch up with a smaller compartment loaded with substrate (S) placed immediately in front of it. Merging triggers the hydrolytic reaction leading to the formation of product P (monitored at 405 nm). (B) Confirmation and sizing of the droplet sequence. (i) Four sets of six droplet pairs of enzyme (E) and substrate (10 and 50 mM, referred to as S10 and S50, respectively) of varying sizes were produced. (ii) The enzyme/substrate droplets were analyzed shortly after generation, and prior to merging, to determine the precise size of each droplet. Sizes were measured by determining the distances Ls (length of the substrate droplet) and Le (length of the enzyme droplet) as described previously. The illumination source was a cold white LED, and the fiber core sizes for illumination and detection were 100 and 50 μm, respectively. (C) Automated concentration gradient. The substrate concentration range after mixing of all droplet pairs was 1.3–38.2 mM. The color code relates the data points in (C) to the primary data in (B)(i).