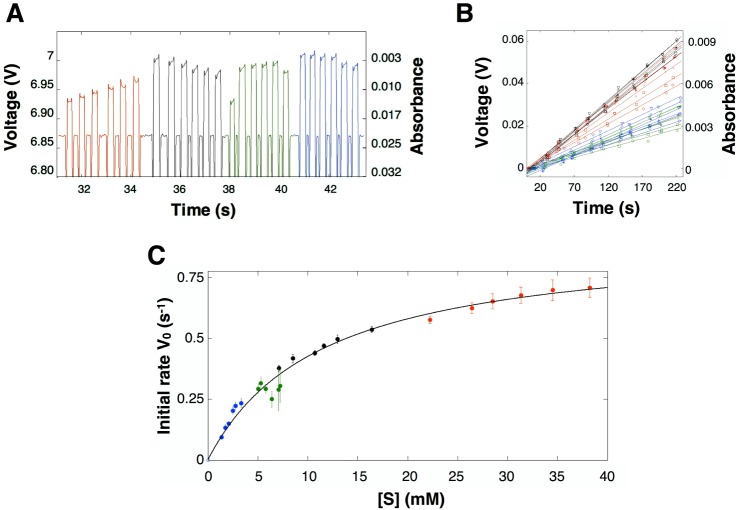
Figure 5.
Derivation of Michaelis–Menten plots from primary data. (A) Confirmation of fusion of droplet pairs and initial assay reading. The first data point was measured 30 s after initiating the acceleration to cause merging. The LED used for these absorbance measurements emitted at 405 nm. The color code corresponds to the same data points as in Figure 3. (B) Time-resolved measurements of average absorbance value for each assay point, with corresponding linear fits superimposed. Initial readings were set to zero volts to highlight the diversity of slopes. The color code corresponds to the droplets displayed in Figures 3B,C and 4A. (C) Michaelis–Menten plot based on 24 substrate concentrations extracted from the data in (A) and (B). The values for Vo are obtained by converting the voltage change per time into a concentration change per time and then dividing these values by the enzyme concentration. Colors correspond to the dilution set of Figure 3 and groups of initial rates in Figure 4B. Error bars shown represent the error in the linear fits shown in Figure 4B.

