
Figure 6.
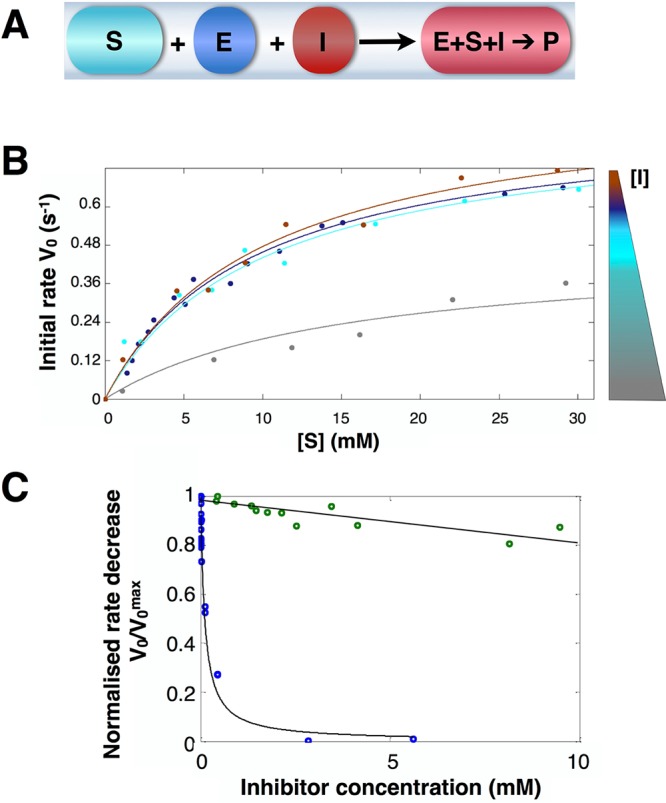
Determination of inhibition kinetics. (A) Schematic for triplet droplet merging. (B) Michaelis–Menten plot in the presence of selected concentrations of 1-deoxynojirimycin hydrochloride (DNM). The final concentrations of inhibitors were 200 μM (dark gray), 20 nM (cyan), 200 pM (brown), and 0 nM (purple). Here, enzyme concentration was fixed at 16.5 nM. (C) Normalized rate change V0/V0max versus inhibitor concentration for DNM (blue dots) and CBE (green dots). The data points for DNM were fitted to generate an IC50 (see text for details). For CBE a line was drawn merely to guide the eye. Conditions: [E] = 19 nM; [S] = 23 mM; [PBS] = 100 mM (pH 7.4).