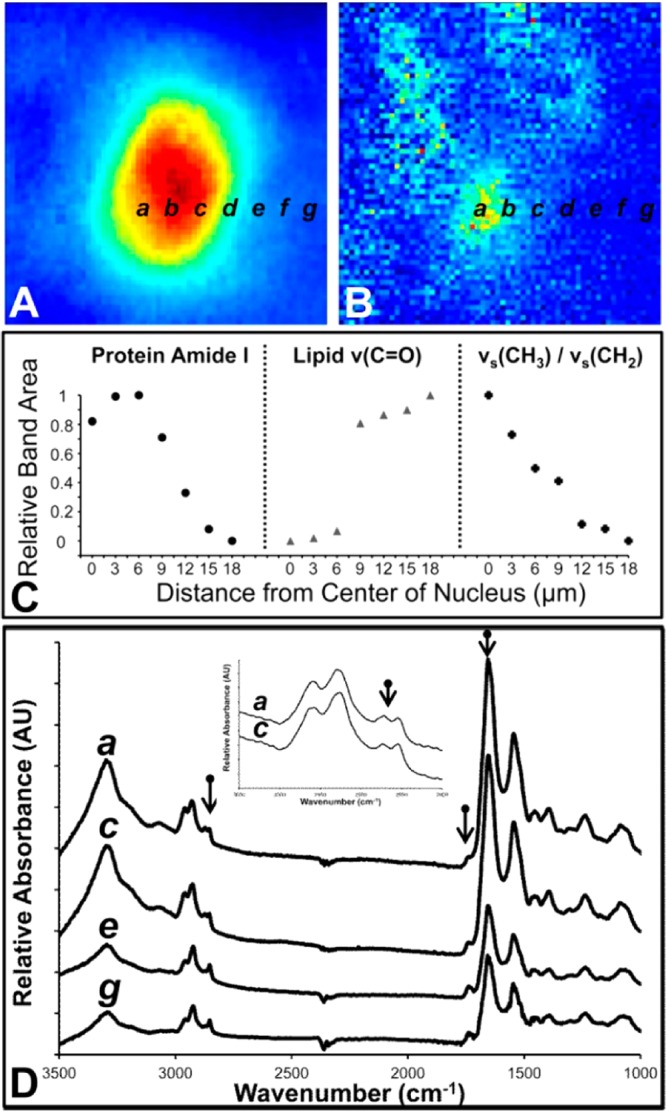
Figure 3.

Representative line map of a cross section through a Purkinje neuron and surrounding molecular layer tissue. (A) Relative protein distribution from integrated area under the amide I band. (B) Ratio of methyl to methylene groups ν(CH3):ν(CH2), which highlights the location of the Purkinje neuron nucleus. (C) Line maps generated from integrated areas underneath the amide I band (protein), carbonyl band (lipids), and the methyl to methylene ratio from spectra extracted at 3 μm intervals from the center of the nucleus (a–g). (D) Representative spectra from locations a, c, e, and g from parts (A) and (B). The inset highlights the increased methyl to methylene ratio observed in the nucleus relative to the cytoplasm within the Purkinje neuron.
