
Figure 5.
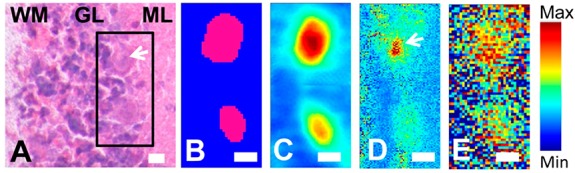
SR-FTIR-FPA imaging investigation of the protein and lactate content of Purkinje neurons (Synchrotron Radiation Center, Wisconsin). (A) Visible light image of the H&E stained tissue section (stained after spectroscopic analysis). Black rectangle indicates region of spectroscopic analysis, white arrow indicates Purkinje neuron with visible nucleus. (B) K-means cluster analysis (2 group) of FTIR spectra revealed two clusters assigned to Purkinje neuron soma (pink) or surrounding tissue (blue). (C) False-color functional group image generated from area underneath the protein amide I band (1690–1610 cm–1). (D) False-color functional group image generated from the ratio of the area underneath the νs(CH3) band (2880–2865 cm–1) and νs(CH2) band (2860–2845 cm–1), to reveal the presence of neuron nuclei (white arrow). (E) False-color functional group image generated from second-derivative intensity at the lactate sensitive region 1127 cm–1 (lactate ν(C–O)). WM = white matter, GL = granular layer, ML = molecular layer. Scale bars: (A–E) = 10 μm.