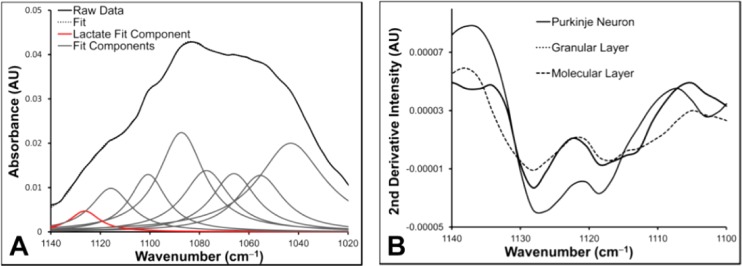
Figure 7.

Determination of relative lactate concentration from FTIR spectra. (A) A representative example of the curve fitting approach used to determine the integrated area underneath the band centered at 1127 cm–1. This approach was used to demonstrate the significant increase in integrated band area for the band centered at 1127 cm–1 from the average spectra collected from Purkinje neurons relative to the surrounding molecular and granular layer tissue presented in Table 1. (B) Representative second-derivative spectra from a Purkinje neuron and surrounding molecular and granular layer tissue, highlighting the increase intensity at 1127 cm–1 from spectra collected within the Purkinje neuron.
