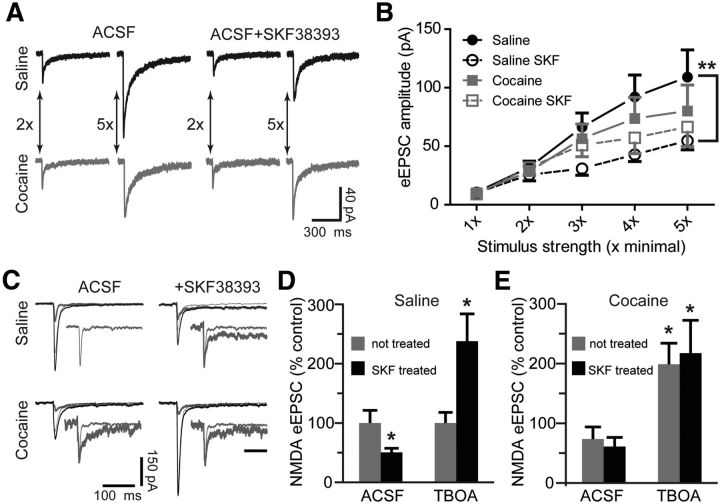
Figure 1.
Blockade of glutamate reuptake reverses the D1DR stimulation-induced decrease of NMDAR-mediated eEPSCs. A, Representative NMDAR eEPSC averages at low (2×) and high (5×) stimulation intensities following D1DR agonist (SKF38393, 10 μm) pretreatment of slices from yoked saline and cocaine-experienced animals. B, An input–output relationship of NMDAR eEPSCs illustrates reduced synaptic strength following D1DR stimulation in slices from yoked saline rats (F(3,20) = 6.206, Tukey's post hoc; **p < 0.01). C, Representative NMDAR eEPSC averages for TBOA experiments. Three traces are pictured in each experimental group: the combined NMDAR plus AMPAR eEPSC (thick black line), the AMPAR eEPSC isolated by application of dl-AP5 to the same cell (thin black line), and the subtracted NMDAR eEPSC (thick gray line). The inset for the saline ACSF group shows an expanded NMDAR eEPSC trace. In insets for all other groups, this trace is overlayed with the corresponding NMDAR eEPSCs. Amplitudes of overlayed traces are normalized for ease of comparison. Inset scale bar, 100 ms. D, A D1DR agonist-induced decrease of NMDAR eEPSCs under normal recording conditions contrasts with D1DR agonist-induced increase of NMDAR eEPSCs under conditions of glutamate reuptake transporter blockade by TBOA (30 μm; t(9) = 2.38 for SKF-treated ACSF; t(15) = 2.64 for SKF-treated TBOA; n = 5–9 cells; *p < 0.05 vs respective not-treated group). E, Cocaine treatment slightly decreases the NMDAR eEPSCs recorded in normal ACSF, but significantly increases the NMDAR eEPSCs recorded in the presence of TBOA. D1DR stimulation has no effect on NMDAR-mediated currents in either recording condition. The data are expressed as percentage difference from the respective not-treated saline group (t(17) = 2.22 for not-treated TBOA; t(11) = 2.41 for SKF-treated TBOA; *p < 0.05; n = 5–11 cells).

