
Figure 1.
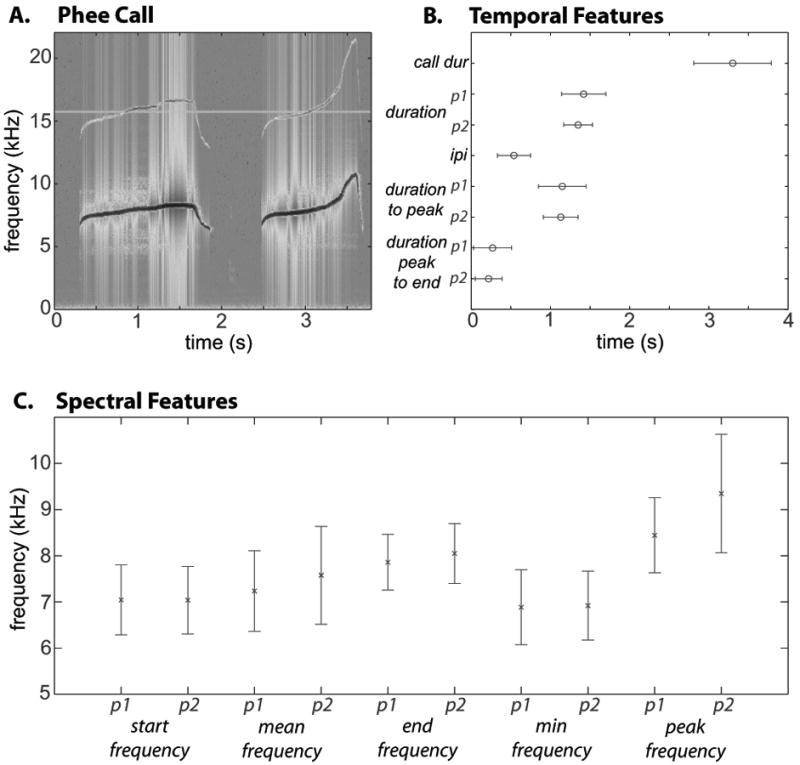
Spectro-temporal structure of marmoset phee calls. A. A spectrogram of a phee call. B. Temporal features measured for all phee calls. Features measured in both the first and second pulses of the phee are noted by ‘p1’ (pulse 1) and ‘p2’ (pulse 2). The mean of each feature is noted with a ‘o’, error bars mark standard deviation. C. Spectral features measured for all phee calls. Features measured in both the first and second pulses of the phee are noted by ‘p1’ (pulse 1) and ‘p2’ (pulse 2). The mean of each feature is noted with a ‘*’, error bars mark standard deviation.