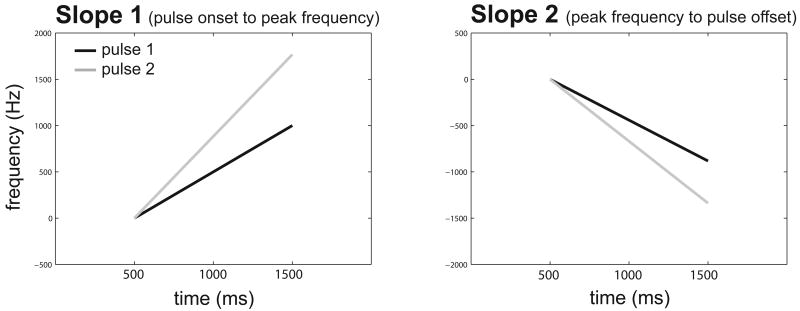
Figure 2.
Slopes for phee calls. Slope 1, shown to the left, plots the rising slope (Hz/s) in phee calls that occurs from the pulse onset to the peak frequency. Slope 2, shown to the right, plots the descending slope (Hz/s) from the peak frequency to the pulse onset. Pulse 1 is shown in the black line, while pulse 2 is shown by the grey line.

