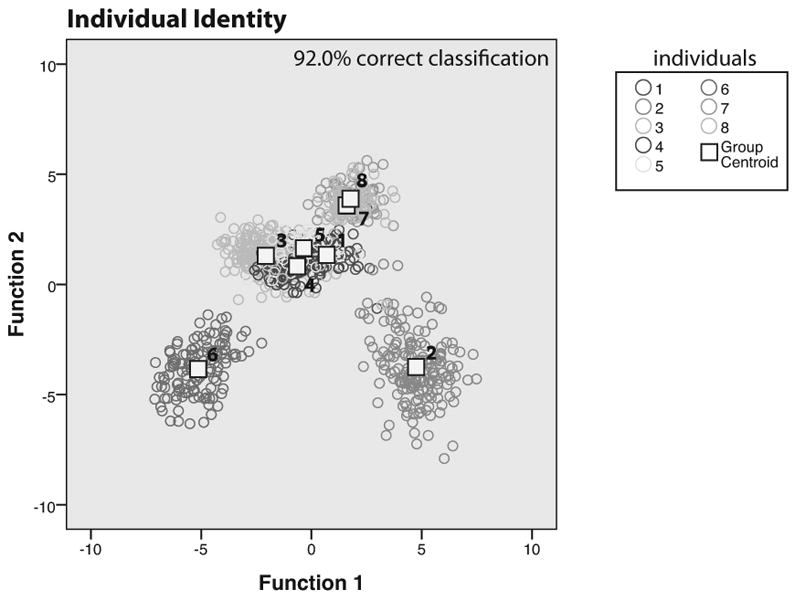
Figure 3.

Discriminant functions for caller identity information. Plots the first and second functions from the discriminant function analysis for ‘Individual Identity’. Squares mark the group centroids for each of the 8 individuals whose calls were analyzed in the study, while colored open circles depict individual vocalizations produced by each individual.
