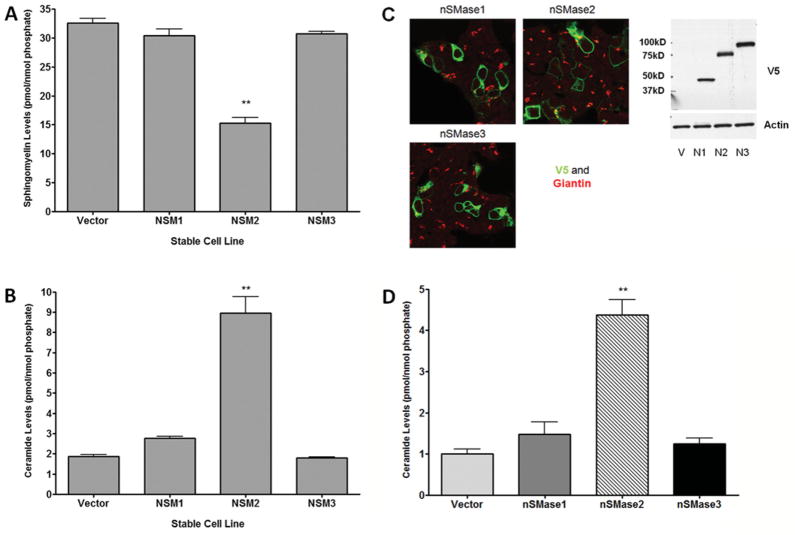
Figure 6. Overexpression of nSMase2, but not nSMase1 or nSMase3, in HEK-293 cells alters cellular sphingolipid levels.
HEK-293 cells stably expressing vector, nSMase1 (NSM1), nSMase2 (NSM2) or nSMase3 (NSM3) were plated for 48 h. Total SM (A) and ceramide (B) levels were analysed by LC-MS/MS as described in the Materials and methods section. Lipid levels were normalized to total lipid phosphate. Results, expressed as pmol of lipid/nmol of phosphate, are means ± S.E.M. (**P < 0.01, n = 3). (C) HEK-293 cells were transiently transfected with nSMase1, nSMase2 or nSMase3 for 24 h. Transfection efficiency was determined by indirect immunofluorescence and confocal microscopy, and protein expression was determined by immunoblotting as described in the Materials and methods section. Confocal images are representative of at least five fields taken from each of four independent experiments; immunoblotting is representative of four independent experiments. Molecular-mass markers (in kDa) are shown on the left. (D) HEK-293 cells were transiently transfected with nSMase1, nSMase2 or nSMase3 for 48 h. Cellular ceramide levels were analysed by LC-MS/MS. Results are mean ± S.E.M. total ceramide levels normalized to total lipid phosphate. (**P < 0.01, one-way ANOVA with Dunnet’s post-hoc test, n = 4).

