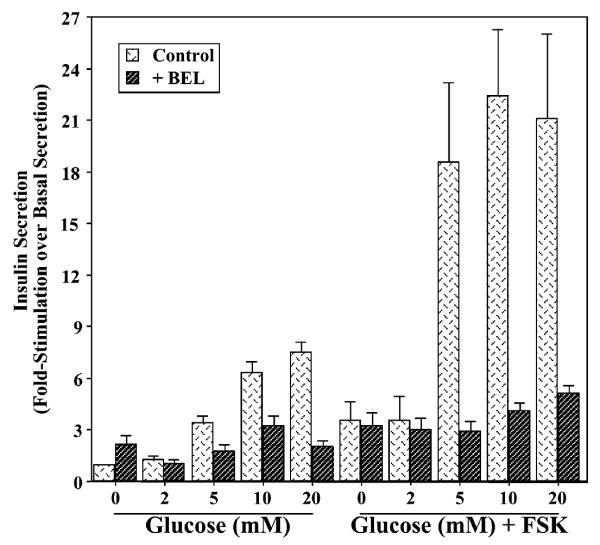
Figure 9.
Insulin secretion from 832/13 INS-1 cells. Cells were seeded in 24-well plates and incubated (1 h, 37 °C, 95% air/5% CO2) in KRB medium containing glucose alone or glucose plus forskolin (FSK, 2.5 μM) in the absence and presence of BEL (10 μM). At the end of the incubation period, insulin content in the media was determined by RIA. Stimulated increases in insulin secretion are plotted as mean ± SEM, relative to basal (zero glucose) secretion (n = 5–7).

