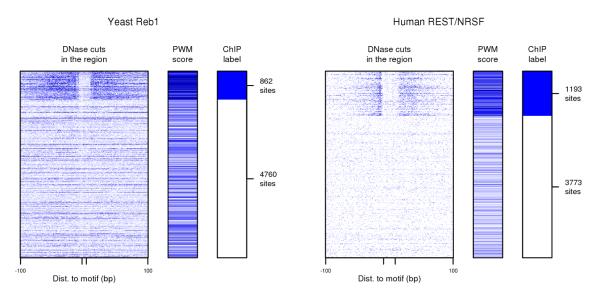
Fig. 1.

DNase digestion data used in conjunction with TF binding specificity information can be used to identify TF binding sites. Left panel shows data for Reb1 candidate binding sites in yeast, and right panel shows data for REST (also known as NRSF) candidate binding sites in human. In each case, rows represent candidate sites based on PWM matches; rows are grouped by ChIP labels into positive and negative sets and then randomly ordered within each set. For each candidate binding site, columns depict DNase cuts in the region 100bp up- and downstream, PWM score, and ChIP label. Darker blue in data columns indicates higher number of DNase cuts at each position or higher PWM score. The figure makes clear that (a) both DNase data and TF binding specificity information provide noisy evidence of TF binding, and (b) since DNase cuts near Reb1 binding sites have a distinct pattern from DNase cuts near REST binding sites, methods using TF-specific DNase signatures are more likely to be effective at identifying TF binding sites.
