
Fig. 2.
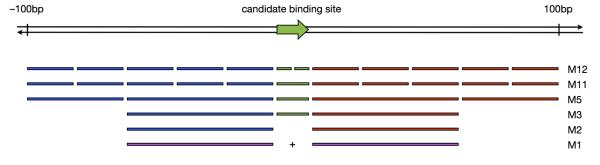
Understanding the relationships between bins in various millipede models. All bins are defined relative to the orientation of the candidate binding site: green bins are within the binding site, blue bins are upstream, and red bins are downstream. Models are arranged from most to least complex, so that each simpler model is derived from the one above it by merging or dropping bins. The simplest model M1 arises when the upstream and downstream bins of M2 are merged (thus shown in purple).