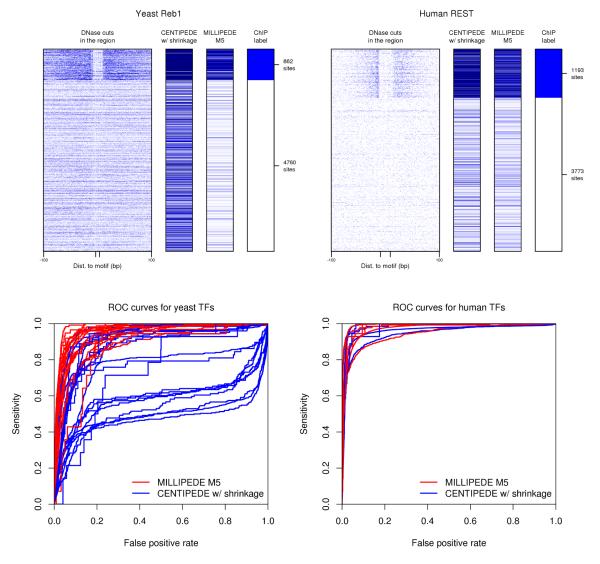
Fig. 4.
Comparing millipede model M5 to centipede across all yeast and human TFs. Top panels are akin to those of Figure 3, but compare millipede model M5 to centipede with shrinkage estimates of multinomial parameters for yeast Reb1 and human REST. To reduce clutter, we only show centipede results with shrinkage, since this performs noticeably better in an ROC setting than without (as shown in Figure 5). To confirm that results hold beyond the specific cases of Reb1 and REST, bottom panels show ROC curves for millipede (red) and centipede (blue) across all 20 yeast TFs (left) and all six human TFs (right). Two other yeast factors are shown later in Figure 6.

