
Fig. 5.
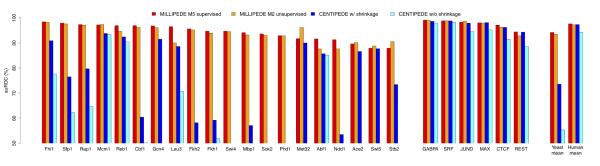
Area under the ROC curve for 20 yeast and six human TFs. Red bars are millipede model M5 run in a supervised mode, orange bars are millipede model M2 run in a completely unsupervised mode, blue bars are centipede with shrinkage, cyan bars are centipede without shrinkage. Bars start at 50% since that represents random performance for an ROC curve; values below 50% are just not shown (e.g., for centipede on Swi4, Sok2, and Phd1). The 20 yeast TFs are listed before the six human TFs; within each organism, the TFs are sorted such that the red bars decrease in height (the poor performance for Ace2 and Swi5 is perhaps unsurprising since the yeast DNase data are from cells arrested in G1). As summarized in the far right bars, mean performance is remarkably similar across the six human TFs, but millipede improves dramatically upon centipede in yeast, even when run completely unsupervised.