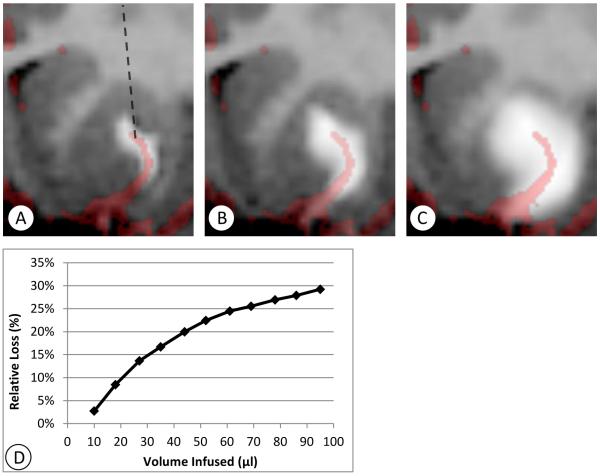
Figure 2.
Example of perivascular loss (Cy0287-right). T1 maps (negated) were re-sliced obliquely at approximately 45 degrees between the coronal and axial planes, so that an artery located near the catheter tip is visible. MR angiography is co-registered and overlaid, illustrating the location of the nearby artery and the correlation of the asymmetric flow to the path of the artery. A: Ten minutes after the start of infusion the highly asymmetric flow is visible. The projection of the catheter into this oblique plane is shown in A (dashed line). The catheter itself lies in the coronal plane. The infusion continues to expand laterally as the infusion proceeds, as shown in B: 27 minutes after the start of infusion, and C: 95 minutes after the start of infusion.

