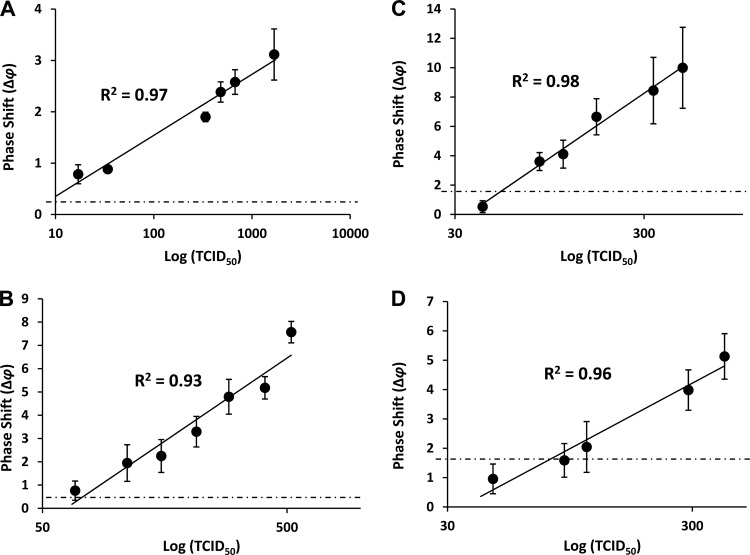
Fig 1.
Detection of HIV-1 and HIV-2 in PBS buffer and human serum. Quadruplicate measurements (mean ± standard error) were taken at 5 min after the addition of virus. The x and y axes indicate viral load in the TCID50 (logarithmic scale) and phase shifts (Δφ), respectively. (A) HIV-1 in defined buffer (PBS); (B) HIV-2 in defined buffer (PBS); (C) HIV-1 in 50% human serum; (D) HIV-2 in 50% human serum. The solid lines represent the best-fit models and correlation coefficients (R2) for Δφ values as a function of viral load. The horizontal dotted lines represent the background signals obtained with buffer or serum without virus.

