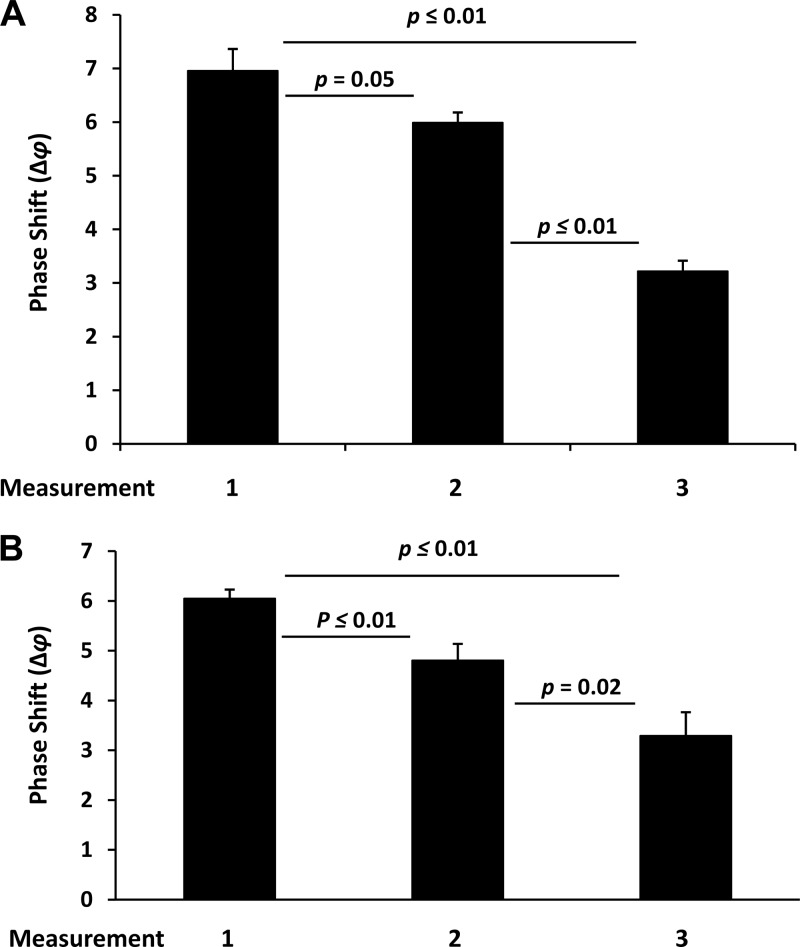
Fig 3.
Reusability of biosensor chips for HIV-1 (A) and HIV-2 (B) detection at 520 and 672 TCID50s, respectively. Measurements (2 per lane on three lanes, 5 min after the addition of virus) were taken on 3 chips after the first coating (measurement 1), after the first antibody elution (measurement 2), and after the second antibody elution (measurement 3). The Δφ values (y axis) for measurements 1 to 3 are shown. Bars represent the means (n = 6) with standard errors. The differences were calculated for significance (P values) using the t test.

