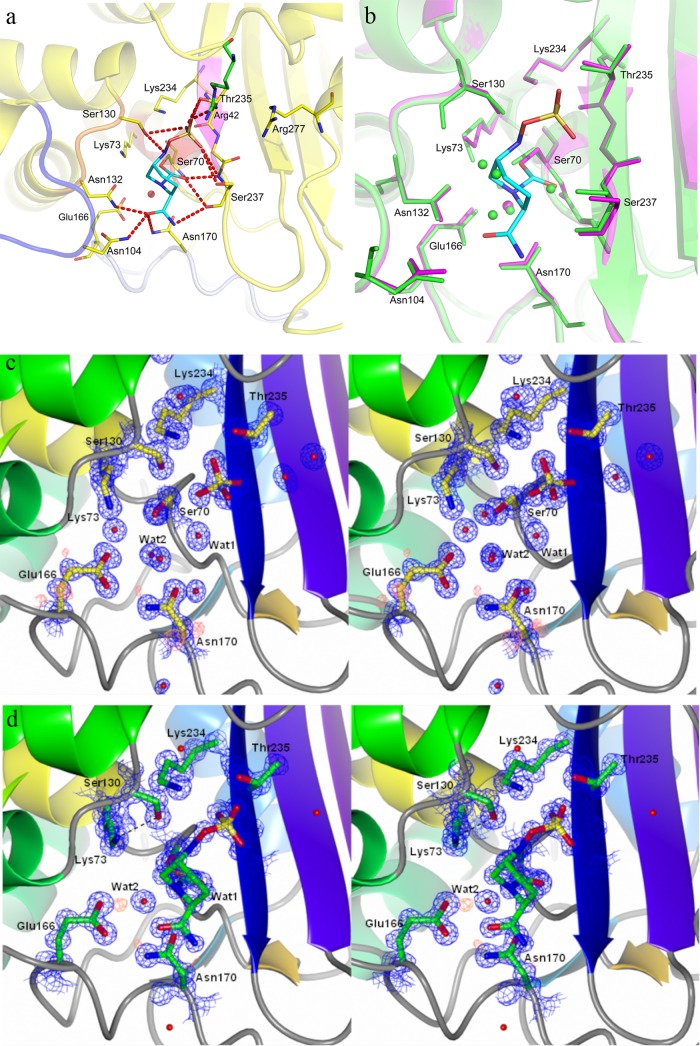
Fig 2.
Active site of CTX-M-15 in native avibactam and avibactam-enzyme complex. (a) Avibactam interactions in the CTX-M-15 pocket. Residues around the binding pocket of the avibactam–CTX-M-15 crystal structure are depicted as yellow sticks, and that from adjacent crystal contact (Arg42) is colored green. Avibactam is depicted in cyan. Polar interactions within 4 Å are shown in red dashed lines. Backbones from different secondary structural elements are colored differently. Deacylating water is depicted as a red sphere. (b) Overlay of the native CTX-M-15 active site (magenta) on CTX-M-15 covalently bound to avibactam (green). The residues within 4 Å around avibactam are shown in sticks. Avibactam is depicted in cyan, while the water molecules from each structure are shown as spheres with the respective colors. (c) Electron density map of CTX-M-15 in the native structure. The 2Fo-Fc map in blue is contoured at 1.5 sigma, and the fo-fc map in red is drawn around Glu166 for clarity. Residues are depicted as yellow sticks, while water is shown as red spheres. (d) Electron density map of the CTX-M-15 active site bound to avibactam. The 2Fo-Fc map (contoured at 1.5 sigma) is shown in blue, while the Fo-Fc map is shown in red, around Glu166. Residues and avibactam are depicted as green sticks, while water is shown as a red sphere.

