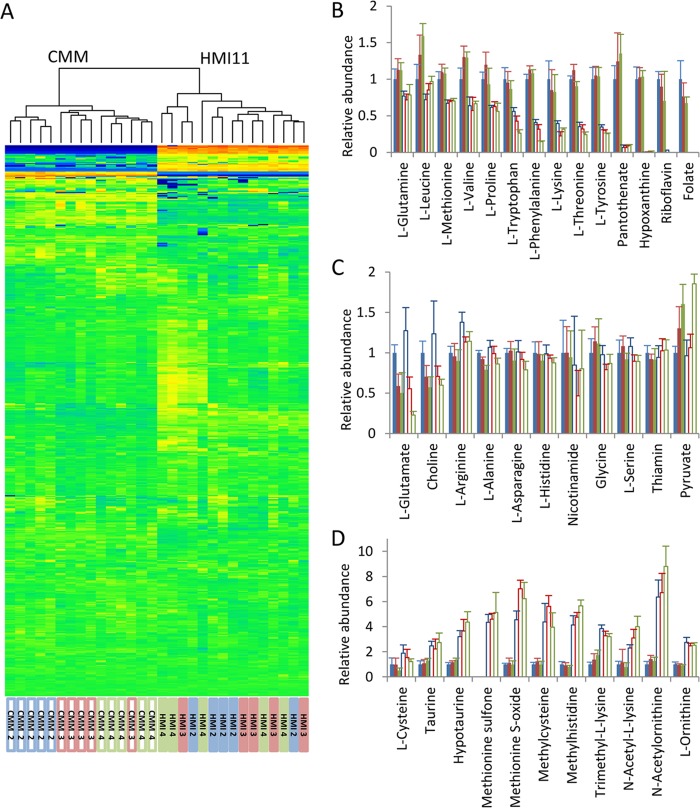
Fig 3.
Comparison of the intracellular T. brucei metabolome in HMI11 versus CMM during the late log growth phase from 2 × 10⁶ to 4 × 10⁶ cells ml−1. (A) Heat map of all putatively identified metabolites (rows) obtained by hierarchical clustering analysis. Samples (columns) cluster according to the growth medium, but most intracellular metabolite levels are unchanged. Heat map data are log transformed and mean scaled. Orange, increased abundance; blue, decreased abundance; green, unchanged abundance. (B) Numerous HMI11 components accumulate to greater levels in HMI11-grown cells (filled columns) than in CMM-grown cells (open columns). (C) Many metabolites were not significantly different between cells grown in the two media, including a number of HMI11 components that were absent from the CMM formula. As the cell density increased, an increase in pyruvate and a decrease in glutamate were observed in both media. (D) Examples of putative metabolites with a higher relative abundance in CMM than in HMI11, showing changes in amino acid metabolism involving methylation, acetylation, and sulfur or redox metabolism. y axes show mean normalized LC-MS peak heights relative to those of cells grown in HMI11 at 2 × 10⁶ cells ml−1. Error bars represent standard deviations. Five biological replicates of each cell density, i.e., 2 × 10⁶ (blue columns), 3 × 10⁶ (red columns), and 4 × 10⁶ (green columns) cells ml−1, were measured.

