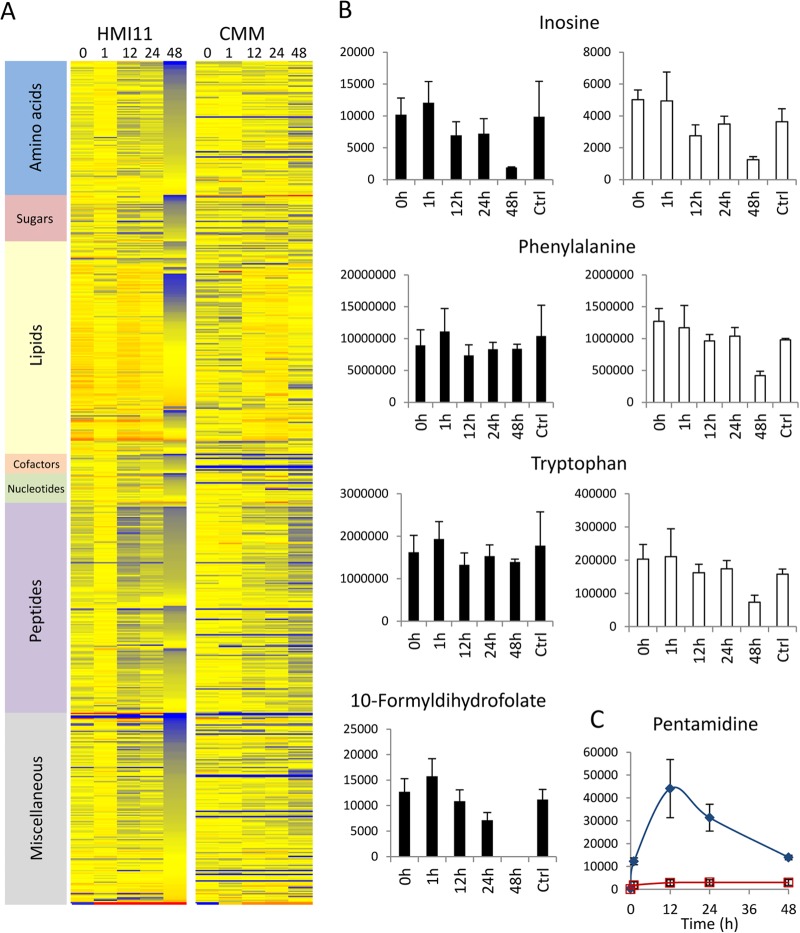
Fig 5.
Pentamidine-induced changes in the metabolome over a 48-h time course in CMM versus HMI11. (A) Heat map of changes in the abundance of all putative metabolites relative to that in untreated controls (Ctrl) during the 48-h time course in HMI11 and CMM. Red, increased; blue, decreased; yellow, unchanged. (B) Inosine decreased significantly after 48 h of treatment in both media. Decreases in phenylalanine and tryptophan could be observed only in CMM. 10-Formyldihydrofolate was detected only in HMI-grown cells. (C) The relative levels of pentamidine were approximately 10-fold higher in HMI11 (blue filled diamonds) than in CMM (red open squares), in agreement with the 10-fold higher dosage. y axes show raw LC-MS peak heights in arbitrary units. The data are the means ± standard deviations of three (CMM) or four (HMI11) biological replicates.

