
Fig 3.
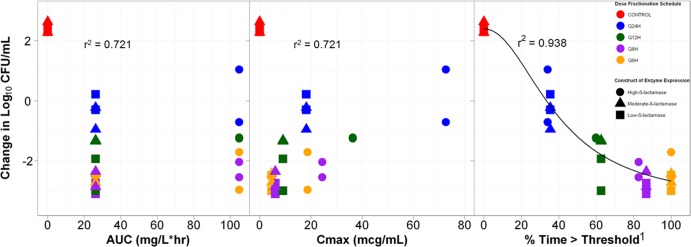
Relationships between three tazobactam exposure measures, AUC, Cmax, and %Time>threshold, and the change in log10 CFU of isogenic CTX-M-15-producing E. coli after 24 h of therapy in a PK-PD in vitro infection model. The color of the symbols represent the different dose fractionation schedules, while the shape of the symbol represents the level of β-lactamase production. Cmax is shown in micrograms per milliliter. 1, the threshold concentration was 0.05 μg/ml for the low- and moderate-β-lactamase genetic constructs and 0.25 μg/ml for the high-β-lactamase genetic construct.