
Fig 2.
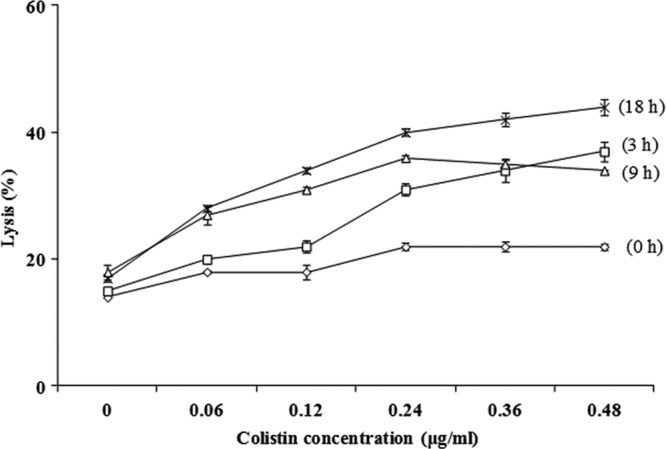
Lysis of E. coli O157:H7 in the presence of colistin at concentration of 0.06, 0.12, 0.24, 0.36, and 0.48 μg/ml for 0 h (♢), 3 h (□), 9 h (△), and 18 h (×) at 30°C. Error bars represent standard deviations calculated from duplicate experiments.