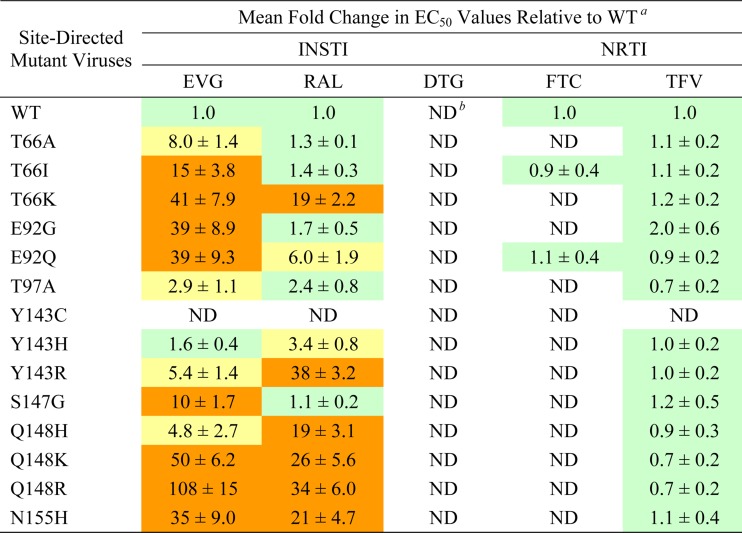
Table 2.
Antiviral susceptibilities of INSTIs and NRTIs against HIV-1 in multiple-round replication assays

a Data shown represent the means and standard deviations from at least three independent experiments. Color coding indicates the degree of reduced susceptibility: less than or equal to 2.5 (green), greater than 2.5 and less than 10 (yellow), and greater than 10 (orange). All fold change values of >2.5 demonstrated a statistically significant difference compared to the WT by using a two-tailed Student t test, assuming equal variance (P < 0.01).
b ND, not determined.
