
Fig 2.
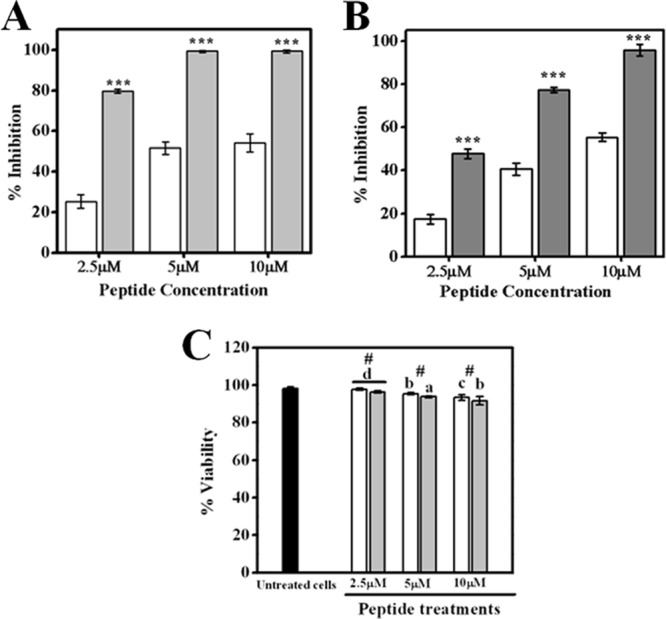
Effects of treatment with TempL and Q3K-TempL on production of proinflammatory cytokines by rat bone marrow-derived macrophages stimulated with LPS (100 ng/ml). (A) Percent inhibition of LPS-induced TNF-α production in macrophages by TempL (open bars) and Q3K-TempL (shaded bars) at concentrations of 2.5 μM, 5 μM, and 10 μM, as marked. (B) Percent inhibition of LPS-induced IL-6 production in macrophages by TempL (open bars) and Q3K-TempL (shaded bars) at concentrations of 2.5 μM, 5 μM, and 10 μM. (C) Data on percent viability of macrophages after the above-described experiments at different peptide concentrations, namely, 2.5 μM, 5 μM, and 10 μM, as indicated. In order to calculate the percentages of inhibition of cytokine production in LPS-stimulated macrophages by TempL and its analog, the amounts of cytokines produced in non-LPS-treated and LPS-treated cells (without addition of peptides) were taken as control values for minimum and maximum cytokine production levels for a given experimental set. (A and B) Results are presented as means ± standard deviations (SD); n = 3. ***, P < 0.001 versus TempL. (C) Results are presented as means ± SD; n = 3; #, P > 0.05 with respect to TempL; P < 0.001 (a), P < 0.01 (b), P < 0.05 (c), and P = 0.005 (d) versus untreated cells.