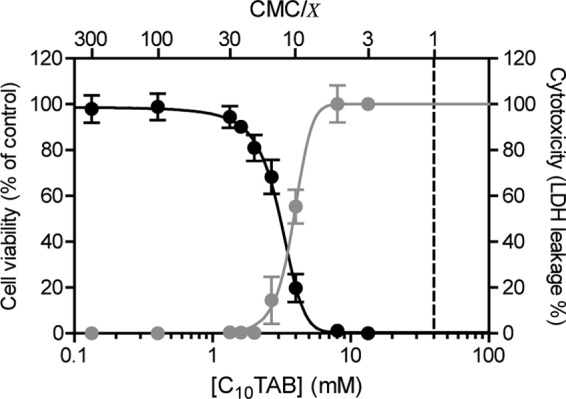
Fig 1.

Concentration dependence of the effects of C10TAB on MDCK cell viability (black) and LDH leakage (gray) after 3 h of exposure. The data are presented as means ± the SD of four independent experiments and expressed as a percentage of control (cell viability) or as a percentage of LDH activity from lysed mock-treated control cells (LDH leakage). Surfactant concentrations in the x axis are represented on a logarithmic scale. The CMC of C10TAB is 4.0 × 10⁻² M.
