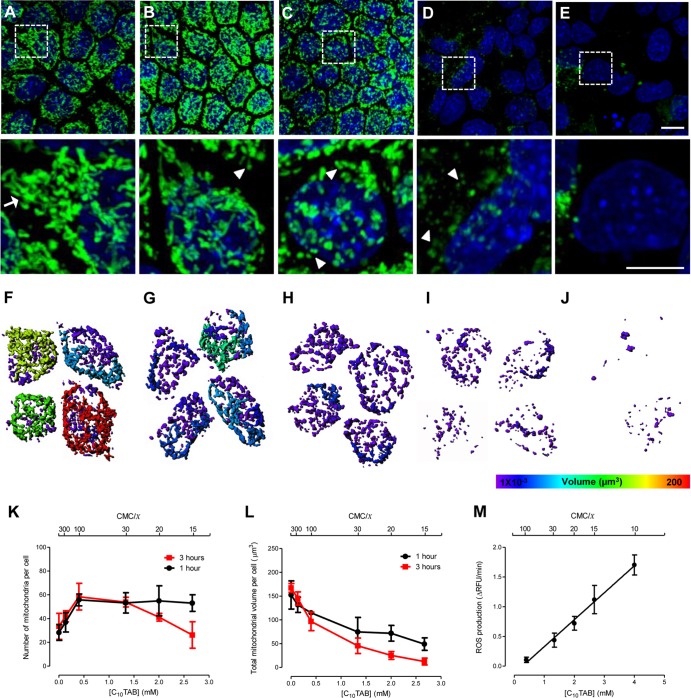
Fig 2.
Morphological changes in the mitochondrial network of MDCK cells after 3 h of exposure to C10TAB. Representative maximal fluorescence intensity projection images obtained by live-cell confocal microscopy, showing the mitochondrial network of MDCK stained with Rh123 (green). Nuclei were visualized with Hoechst 33342 (blue). Zoomed regions of the selected regions in these images are shown in the lower panel. (A) Control cells display reticulotubular mitochondrial morphology, mainly composed of large branched tubules (arrows). Exposure to C10TAB at 0.13 mM (∼CMC/300) (B), 0.4 mM (∼CMC/100) (C), 2.0 mM (∼CMC/20) (D), and 2.7 mM (∼CMC/15) (E) gradually disintegrates the reticulotubular mitochondrial network into a punctiform phenotype, comprising numerous round fragments of various sizes (arrowheads). (E) The loss of Rh123 fluorescence from the mitochondrial regions reflects the dissipation of the Δψm. Scale bars correspond to 10 and 5 μm in the upper and lower (zoomed) images, respectively. (F to J) Mitochondrial distribution and subtyping according to volume in individual representative cells exposed to the same concentrations of C10TAB. Hotter colors indicate larger contiguous mitochondrial volumes. The mitochondrion number (K) and total volume (L) per cell was determined. The data are shown as means ± the SD of 8 to 15 cells per condition of at least three independent experiments. The initial rate of intracellular ROS production measured in cells incubated with increasing concentrations of C10TAB was evaluated using the redox-sensitive fluorescent probe HE. The data are presented as means ± the SD of five independent experiments.

