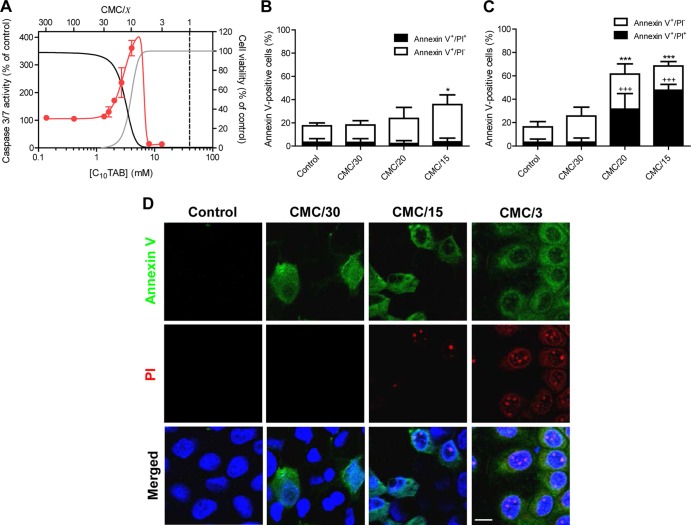
Fig 4.
C10TAB-induced apoptosis in MDCK cell. Concentration-dependent effects of C10TAB on caspase activation after 3 h of exposure (A). The data are presented as means ± the SD of four independent experiments and are expressed as a percentage of the control. The CMC of C10TAB is represented in the graph by the black dashed line. For comparison purposes cell viability (black) and LDH leakage (gray) dose-response curves (presented in detail in Fig. 1) are also shown. Apoptotic (annexin V+/PI−) and necrotic (annexin V+/PI+) cells were imaged using live-cell confocal fluorescence microscopy after 1 h (B) or 3 h (C) of incubation with C10TAB. Fractional cell death (apoptotic or necrotic) and total cell death (apoptotic and necrotic) data are presented as means ± the SD of at least three independent experiments and are expressed as a percentage of the total cell number. Asterisks (*, P < 0.05; ***, P < 0.001) signify differences from the total percentage of dying cells in control; plus symbols (+++, P < 0.001) signify differences from the percentage of necrotic cells in the control. Representative confocal images showing apoptotic cells stained with annexin V (green) and necrotic cells with PI (red) are shown in panel D. Nuclei were visualized by Hoechst 33342 staining (blue). Scale bar, 10 μm.

