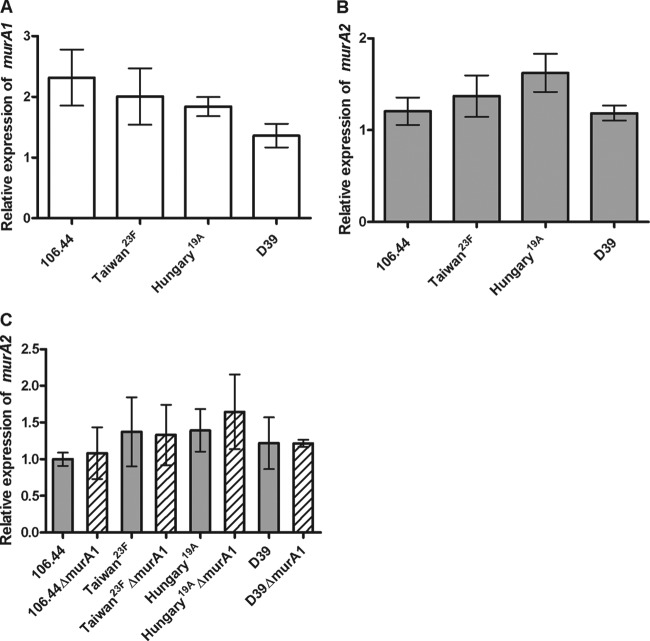
Fig 2.
Relative levels of murA1 (A) and murA2 (B) expression in S. pneumoniae wild-type strains. (C) Comparison of murA2 expression levels in wild-type (gray bars) and murA1 knockout (hatched bars) strains. Expression is displayed as a value relative to that of the isolate with the lowest expression level after normalization to 16S RNA gene expression. Values are means of three independent experiments. The standard error of the mean is shown. No significant differences were detected by analysis of variance.

