Figure 3.

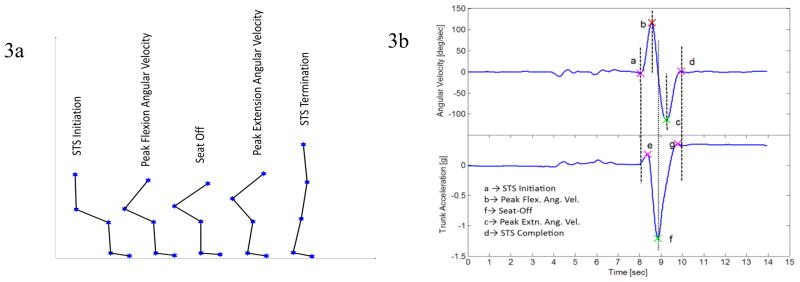
Figure 3a) STS Events identified by IMU data. 3b) upper section of the figure is trunk angular velocity with events (a. STS Initiation, b. Peak flexion angular velocity, c. Peak extension angular velocity, d. STS termination) and lower section of 3b is trunk anterio-posterior acceleration (where f is seat off event)
