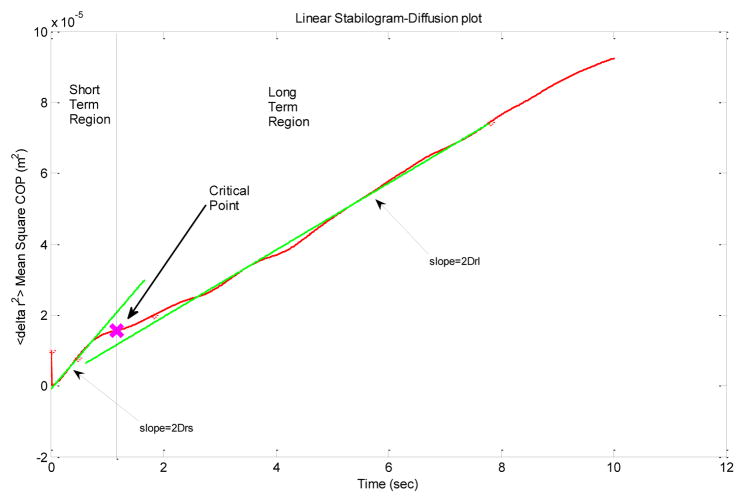
Figure 3.
A schematic representation of a typical resultant planar stabilogram-diffusion plot (<Δr2> vs Δt) generated from COP time series. The effective diffusion coefficients Drs and Drl are computed from the slopes of the lines fitted to short-term and long-term regions, respectively. The critical point, (Δtrc, <Δr2>c), is defined by the intersection of the lines fitted to the two regions of the plot.

