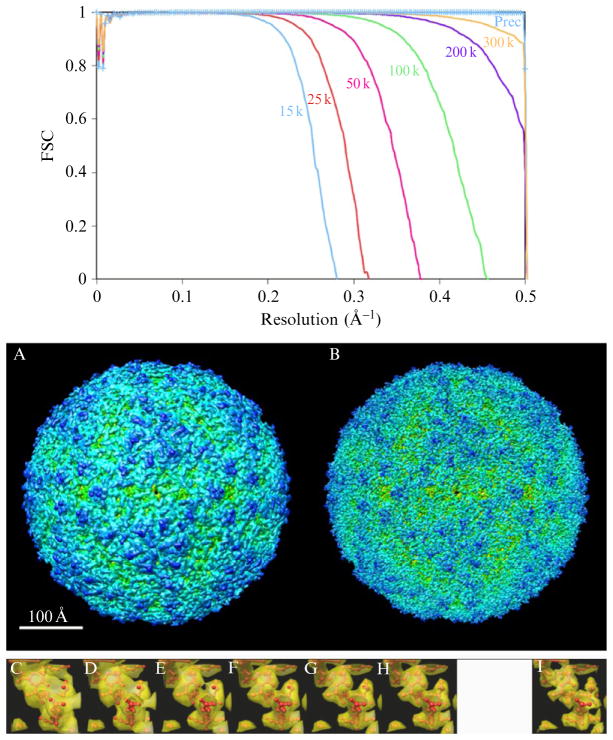
Figure 14.2.
Prec overcomes the curvature problem in Ewald projections. (Top) FSC curves for conventional Bsoft reconstructions of the Foot and Mouth Virus from 5000 “Ewald projection” images simulated with the voltages shown, plus a reconstruction from the 15 kV images calculated by the Prec program, which completely corrects for the curvature problem. (A and B) Isosurface renderings of the conventional and Prec 15 kV reconstructions, respectively. (C–H) Transparent isosurfaces of a single α-helix from the 15, 25, 50, 100, 200, and 300 kV reconstructions, respectively, surrounding the atomic model used to simulate the images. (I) The same helix from the Prec 15 kV reconstruction. FSC curves were calculated with bresolve (Heymann, 2001) and isosurfaces were rendered with Chimera (Pettersen et al., 2004).

