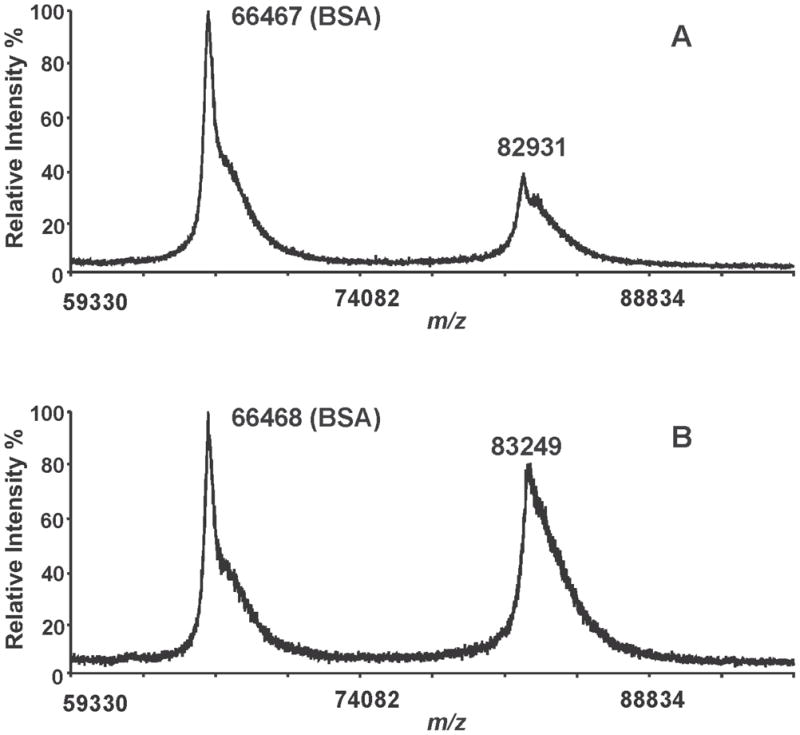
Figure 3. MALDI-TOF mass spectrometric analyses of native and BEL-treated iPLA2β holoproteins.

Native (A) and BEL-treated iPLA2β (B) were mixed with a MALDI matrix solution (5 mg of α-CHCA in 50% acetonitrile/0.1% TFA), and spotted onto a MALDI target plate. Bovine serum albumin was added as a molecular mass marker and the acquired mass spectra were calibrated using its monomeric and dimeric masses. A single peak corresponding to iPLA2β is observed in the BEL-treated sample and there is no indication of the presence of a peak possessing a 5 kDa mass shift. These results demonstrate that the two bands observed by SDS-PAGE of the BEL-treated iPLA2β have similar molecular weights.
