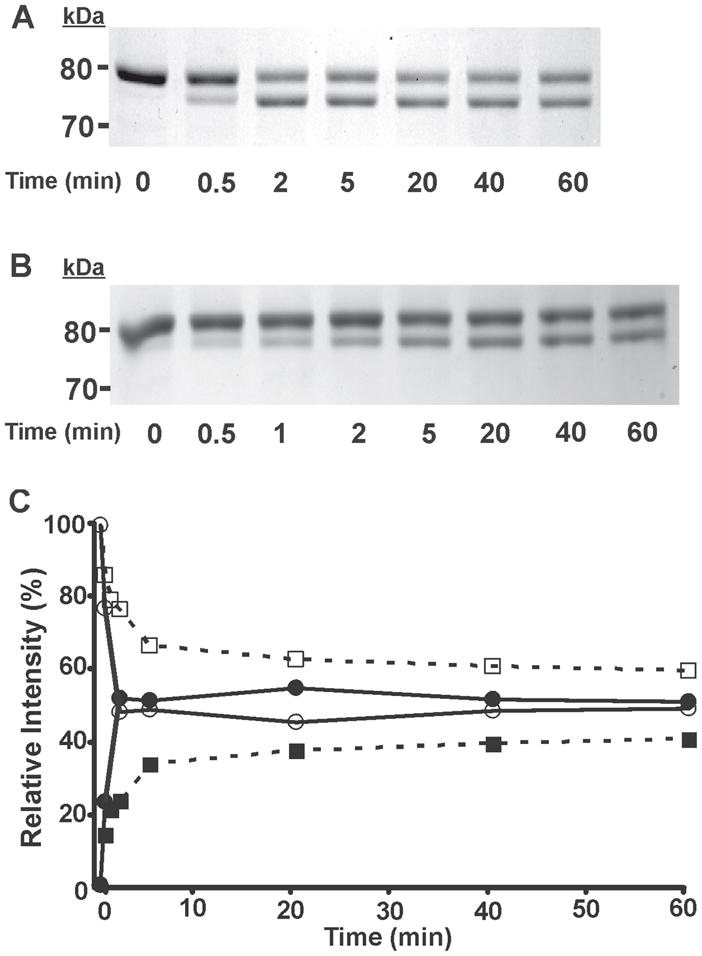
Figure 6. Time course assay analysis of the reaction of (S)-BEL and (R)-BEL with iPLA2β as determined by SDS-PAGE and densitometry.

Purified recombinant iPLA2β was incubated with (S)-BEL (A) and (R)-BEL (B) at 22°C for various time intervals as indicated. The reactions were terminated by adding an equal amount of SDS-PAGE sample loading buffer (2×) and the iPLA2β adducts were separated on a 7% SDS-PAGE gel prior to visualization by Coomassie Blue staining. C, the net intensity of each protein band from A and B were measured utilizing a Kodak Image Station, normalized to the total intensity of the protein bands present in the same lane, and expressed as a percentage of the total intensity. The relative intensity of each protein band was then plotted against the incubation time. Solid circles, 75 kDa band of iPLA2β following incubation with (S)-BEL; Open circles, 80 kDa band of iPLA2β following incubation with (S)-BEL; Solid squares, 75 kDa band of iPLA2β following incubation with (R)-BEL, Open squares, 80 kDa band of iPLA2β following incubation with (R)-BEL. All experiments were performed in duplicate.
