Figure 4.
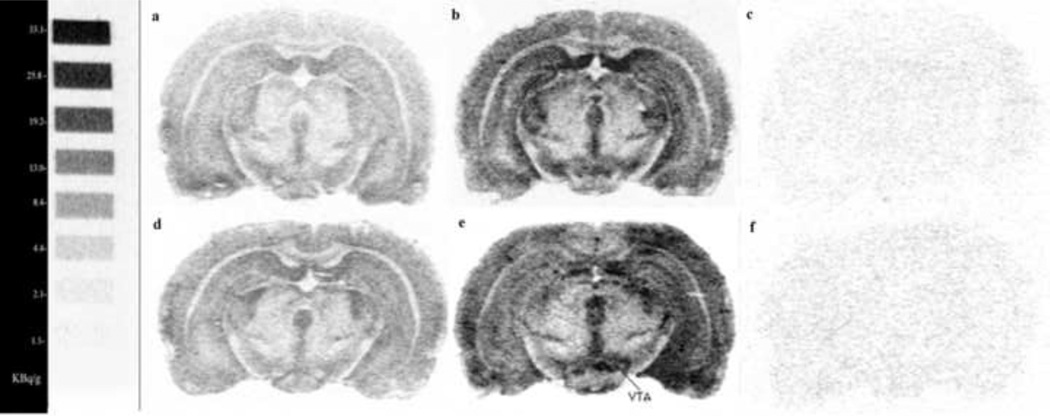
Digital images obtained from autoradiography of coronal brain sections showing the distribution of [35S]GTPγS binding stimulated by kappa opioid receptor. Autoradiograms represent brain sections incubated in presence of 0.04nM radiolabeled [35S]GTPγS without (basal) [a, d] or with 10µM U-69593 (specific binding) [b, e] and in presence of 0.04 nM radiolabeled [35S]GTPγS with 10µM U-69593 and 10µM unlabeled GTPγS (non specific binding) [c, f] in rat withdrawn for 1 day from 14 days of escalating-dose binge saline administration (a, b and c) and withdrawn for 1 day from 14 days of escalating-dose binge cocaine administration (d, e and f) (Bregma = −4.80).
14C scale bar on the left indicates lower levels of G protein activation correspond to 33.1 Kbq/g and higher levels of G protein activation correspond to 1.1 Kbq/g.

