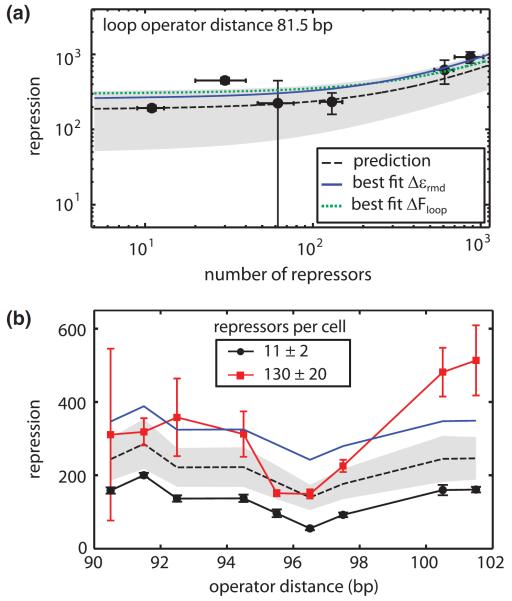
FIG. 2.
(color). Titrating the number of repressors per cell resulted in repression levels similar to predicted values. (a) To predict how repression scales with number of repressors, we first measured repression for a strain with the wild type number of repressors per cell (11 ± 2) and used the equation from Fig. 1(c) to calculate the looping energy. The prediction, as depicted by the dashed black line with the shaded region defining the 95% confidence interval, was compared to other experimental measurements. Global fits of all data points in the figure to the main operator binding energy and the looping energy are shown with the blue solid line and green dotted line respectively. (b) Repression as a function of loop length for two different values of the repressor number per cell. The black dashed line and shaded region show the parameter-free prediction for 130 repressors per cell using the best fit main operator binding energy calculated in (a). The blue solid line shows the global fit to the main operator binding energy for the 130 repressors per cell data. Error bars are standard error.

