
Figure 1.
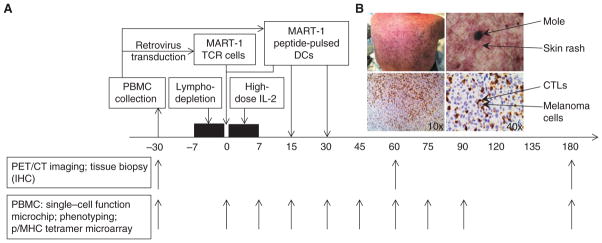
MART-1TCR transgenic T-cell ACT therapy. A, the boxes above the timeline show different modules of the therapy, with arrows pointing to the time they are administered relative to day 0 (the day of the infusion of the TCR-engineered T cells). Arrows below the timeline show the dates when blood samples are collected for different assays. B, photo of one representative patient’s back with skin rash surrounding moles (top). In the immunohistochemical (IHC) staining of a tumor biopsy (bottom), CD8+ CTLs are stained as dark brown and melanoma cells are blue. PET/CT, positron emission tomography/computed tomography.