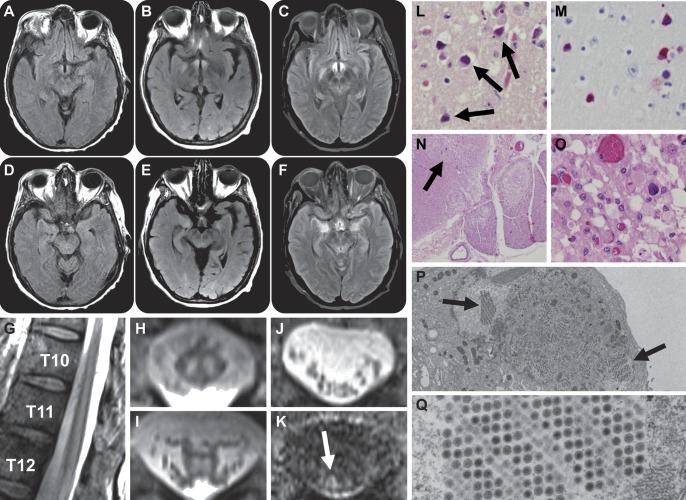
Figure. Imaging and histology.
Progressive abnormal T2 hyperintensity is seen in the hypothalami (A–C) and medial temporal lobes (D–F) at the ninth (B, E) and 23rd hospital days (C, F), compared to MRI at presentation (A, D). Sagittal T2-weighted MRI of the lower thoracic spine shows abnormal central cord hyperintensity extending rostrally from the conus medullaris (G). Axial T2-weighted MRI at the T10 (H) and T12 (I) vertebral levels shows abnormal T2 hyperintensity within the spinal cord gray matter. The spinal cord was not expanded and there was no abnormal cord enhancement following administration of gadolinium contrast (not shown). Axial T2 (J) and T1 postgadolinium (K) MRI at the L3 vertebral level shows abnormal nerve root enhancement (K, arrow). Postmortem hematoxylin & eosin section of the hypothalamic region demonstrates vacuolization, neuronal loss, and reactive gliosis as well as intraneuronal and glial adenoviral inclusions (L, arrows, 400×), also seen on adenovirus-specific immunohistochemical staining (M, 400×). The neocortex, thalamus, caudate nucleus, and dorsal motor nucleus of the vagus were similarly affected (not shown). Hematoxylin & eosin section of the lumbar spinal cord shows parenchymal destruction primarily involving the posterior horns (N, arrow, 20×; O, 400×). Adenovirus inclusions were seen, along with macrophages and axonal swellings (O). Electron micrographs of cell culture obtained from brain tissue show intranuclear inclusions containing nonenveloped hexagonal viral particles of adenovirus (P, 2,700×; Q, 21,000×).

