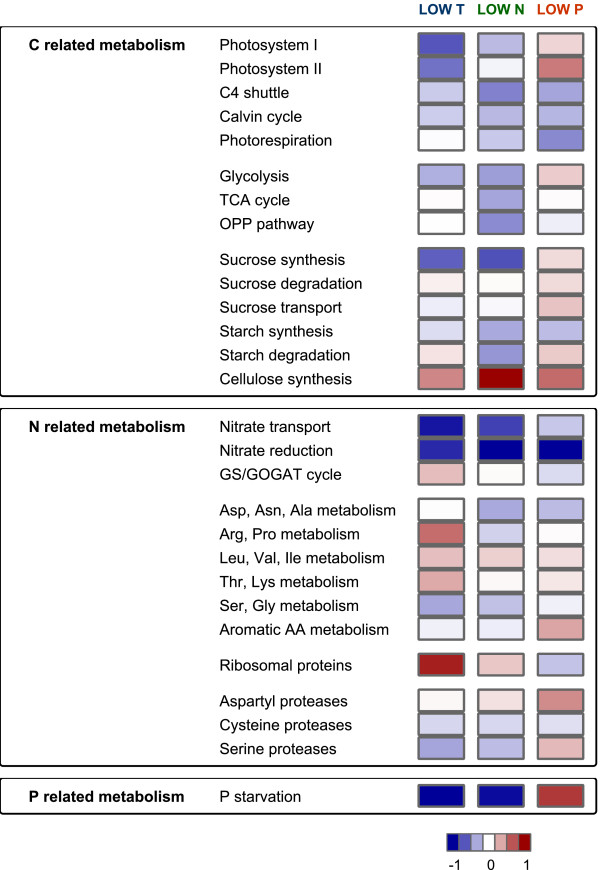
Figure 5.
Summarised transcriptional changes in primary metabolism under low temperature, low nitrogen or low phosphorous stress. Data is presented as log2 values of fold changes (stressed vs control) from the average changes in the pathway. The data behind the average values are presented in Additional file 5: Table S4.

