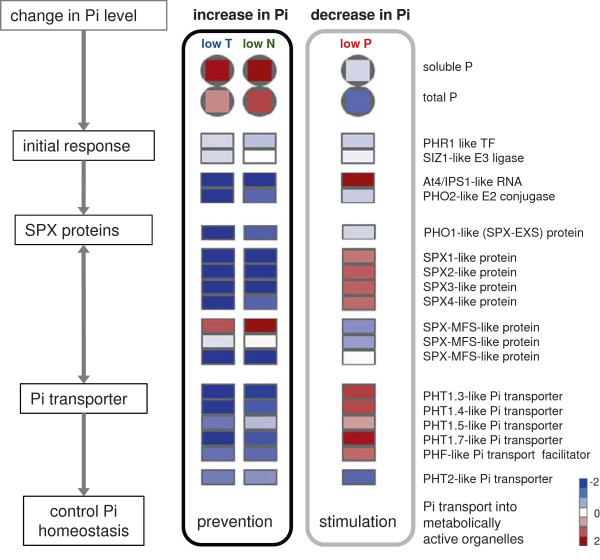
Figure 7.
Regulation of phosphate homeostasis under low temperature, low nitrogen and low phosphorus stress. Leaf concentrations of soluble P (inorganic and organic P) and total P increased under low temperature and low nitrogen stress, but decreased under low P stress. The response of transcripts for initial P starvation response, SPX proteins and phosphate (Pi) transporters is shown as heat maps presenting log2 values of fold changes stress vs control. Sequences with similar expression patterns and the same predicted homologue in Arabidopsis are summarised as mean. Data for the individual sequences behind the heatmaps are listed in Additional file 5: Table S4.

