
Figure 5.
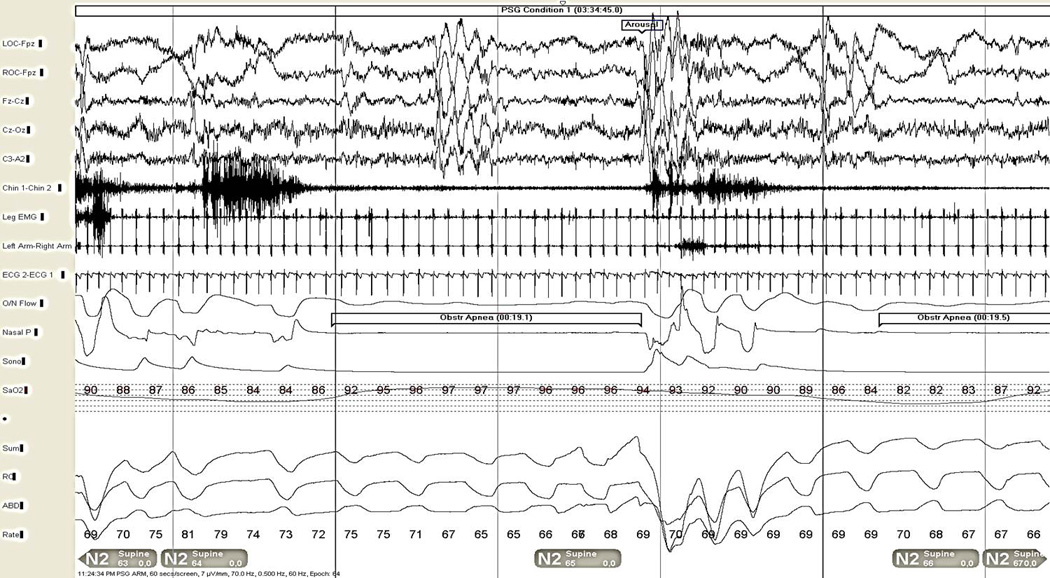
Severe obstructive sleep apnea in a 55-year-old man (shown also in Figure 4), 30 second epoch. The patient is in light NREM (N2) stage sleep. Note the arousal shown in the electroencephalogram channels (top 5 channels), snoring artifact evident in the chin EMG (channel 6), obstructive apnea with cessation of airflow in the oronasal thermistor and nasal pressure sensor channels (channels 10 and 11, respectively), despite continued respiratory effort in the summed, chest, and abdominal respiratory effort channels (channels 14–16). Bradycardia during the apnea is shown on the ECG rhythm strip, with relative tachycardia upon arousal (channel 9, also visible on limb electromyogram leads in channels 7–8). The oxyhemoglobin desaturation seen in the pulse oximetry display (channel 13) in the first half of the epoch is due to another apnea event on the preceding page, while the related desaturation to the apneic event in the first half of this epoch is seen toward the end of the epoch as the next episode of apnea is occurring.